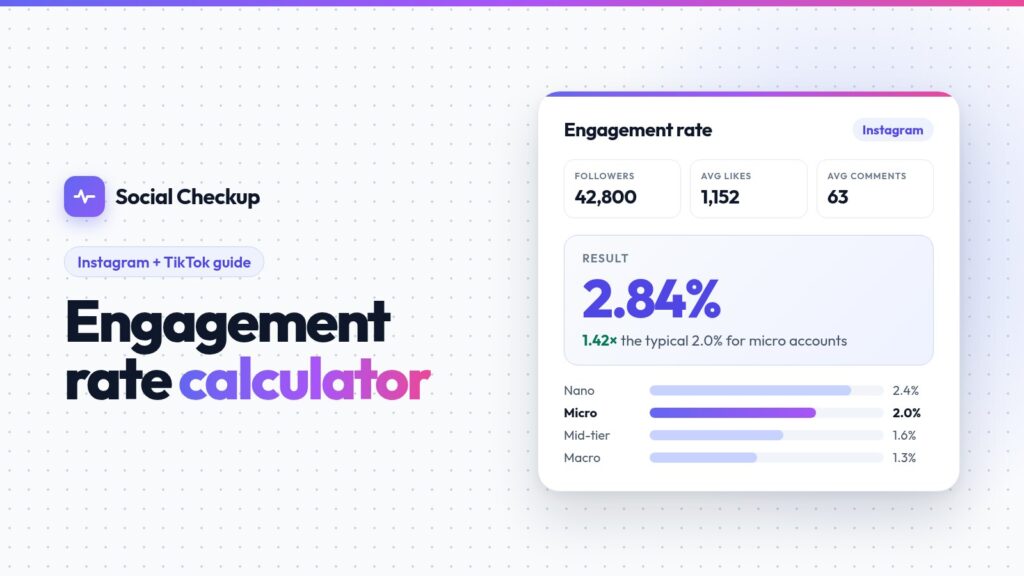
Engagement rate = (average likes + average comments) ÷ followers × 100. On TikTok, add average shares and saves too. Work it out from an account’s latest 10–12 posts, leave out pinned posts, then compare the result with typical rates for accounts of the same size. A big account earning a small rate isn’t failing, and a small account with a big rate isn’t automatically great. Use the free calculator below, or read on for the formula, worked examples and benchmarks for every follower tier.
Engagement rate calculator
The Instagram engagement rate formula
The version brands, agencies and most tools use measures how many followers interact with a typical post:
Engagement rate = (average likes + average comments) ÷ followers × 100
Worked example. An interiors account with 42,800 followers averages 1,152 likes and 63 comments across its last 12 posts. Its engagement rate is (1,152 + 63) ÷ 42,800 × 100 = 2.84%. Micro accounts (10K–50K followers) typically get about 2.0%, so this account is at 1.42× its tier’s typical rate: an audience that pays attention.
The TikTok engagement rate formula
TikTok shows shares and saves on every video, and both are strong signs of interest, so they belong in the count:
TikTok engagement rate = (average likes + comments + shares + saves) ÷ followers × 100
Worked example. A creator with 120,000 followers averages 6,000 likes, 90 comments, 150 shares and 300 saves per video. That’s 6,540 interactions, or 6,540 ÷ 120,000 × 100 = 5.45%. Macro TikTok accounts (100K–500K followers) typically get about 4.5%, so this account is at 1.21×.
TikTok’s For You feed shows videos far beyond the follower base, so it’s also worth working out engagement per view: interactions ÷ average views × 100. If the same creator averages 80,000 views, that’s 6,540 ÷ 80,000 × 100 = 8.2%. The calculator shows both when you add views.
Other formulas you’ll see, and which one to use
- By followers (the formulas above). The only one you can work out for any public account, so it’s the fair way to compare creators.
- By reach: interactions ÷ accounts reached. More precise, but only the account owner can see reach, so you have to ask the creator for screenshots.
- By impressions: interactions ÷ impressions. Also private, and lower than reach-based rates because one person can see a post several times.
- By views: interactions ÷ views. The natural yardstick for Reels and TikTok videos, where views are public.
Whichever you use, compare like with like. A reach-based rate from a media kit will always look higher than a follower-based rate from a tool.
How to collect the numbers
- Use the latest 10–12 posts so the rate reflects the account as it is today, not two years ago.
- Leave out pinned posts. They’re often old, unusually popular and pull the average up.
- Skip posts with hidden like counts rather than counting them as zero.
- Note giveaways and collabs. “Comment to win” posts and collab posts shown on two accounts can double a single post’s numbers.
- Use averages, not totals. Add up the likes, divide by the number of posts, and do the same for comments.
What is a good engagement rate on Instagram?
It depends on audience size. Smaller accounts tend to have tighter communities, so engagement naturally falls as follower counts grow. Comparing a 5K-follower creator with a 500K-follower creator on raw engagement rate isn’t a fair test. These are the typical rates Social Checkup scores Instagram accounts against:
| Tier | Followers | Typical rate |
|---|---|---|
| Nano | Under 10K followers | 2.4% |
| Micro | 10K–50K followers | 2.0% |
| Mid-tier | 50K–100K followers | 1.6% |
| Macro | 100K–500K followers | 1.3% |
| Mega | 500K–1M followers | 1.0% |
| Celebrity | 1M–10M followers | 0.7% |
| Superstar | 10M–100M followers | 0.4% |
| Icon | 100M+ followers | 0.2% |
What is a good engagement rate on TikTok?
TikTok rates run several times higher than Instagram’s, because videos reach people who don’t follow the account and shares and saves are counted. Our TikTok benchmarks are newer and still being calibrated as more accounts are checked:
| Tier | Followers | Typical rate |
|---|---|---|
| Nano | Under 10K followers | 9.0% |
| Micro | 10K–50K followers | 6.5% |
| Mid-tier | 50K–100K followers | 5.5% |
| Macro | 100K–500K followers | 4.5% |
| Mega | 500K–1M followers | 3.8% |
| Celebrity | 1M–10M followers | 3.0% |
| Superstar | 10M–100M followers | 2.4% |
| Icon | 100M+ followers | 2.0% |
Read any rate as a multiple of its tier’s typical rate. Around 1× is normal. At 1.5× or above, the audience is unusually responsive. At 0.5× or below, the account deserves a closer look.
What moves engagement rate
- Account size. The biggest factor, which is why the benchmarks are split by tier.
- Format. On Instagram, carousels and Reels usually earn more interactions per post than single photos. Social Checkup’s full report shows the rate for each format separately.
- Niche. Some communities comment far more than others, so compare creators within the same niche where you can.
- Posting rhythm. Long gaps, or several posts a day, both tend to lower the average per post.
- Artificial boosts. Giveaways, engagement pods and bought likes push the rate up without adding real interest.
Common mistakes
- Judging by the best post. One viral Reel says little about the next sponsored one. Use the typical post.
- Comparing across platforms. A 4% TikTok rate and a 4% Instagram rate mean very different things.
- Ignoring comments. Thousands of likes with a handful of comments can be a sign of bought likes, even when the rate looks healthy.
- Trusting a single number. Engagement rate is a starting point. Pair it with reach, comment quality and the creator’s own insights before you pay.
When engagement is a warning sign
Engagement far below the tier’s typical rate on a large account is the most common sign of bought or inactive followers. Engagement far above it can mean pods or bought likes, especially when comments are short and generic. Our fake follower checker looks at these patterns together for any public Instagram or TikTok account, and the 7 warning signs of fake engagement explains what to look for by hand.
Skip the spreadsheet
A free Instagram audit or TikTok audit collects the latest posts for you, leaves out pinned posts and hidden likes, and shows the averages and a bot-risk level in seconds. The full report adds the engagement rate against similar-sized accounts, a grade out of 100, post-by-post performance and fair rate estimates.
Engagement rate FAQ
Is a 1% engagement rate good on Instagram?
For an account with 500K to 1M followers, yes: 1% is typical there. For an account under 10K followers, 1% is less than half the usual 2.4%, so it’s worth a closer look.
Should I include views in Instagram engagement rate?
Not in the follower-based rate. Views are a measure of reach, not interaction. Compare Reel views with followers separately: Reels reaching a tiny share of followers can mean many followers aren’t real or active.
Can I calculate engagement rate for any account?
Yes, for any public account, because likes, comments and followers are public. Private accounts don’t share their posts, and some posts hide their like counts.
How often does engagement rate change?
With every post. Recalculate before each partnership rather than relying on a media kit from months ago.